

Connecting the dots on a graph may not always reveal a bell, but probably a bridge to show how COVID-19 spreads.
The year 2020 is going to be remembered for the bat virus that shrunk us into small data sets. A cough, cold, fever, headache, or breathing discomfort have never been so frightening or life-threatening. Now we are getting sampled, documented, isolated, and analyzed to predict who is going to cough next!!
The count of COVID positives cases per day (actual count/active count) is used by technologists across the globe to forecast the possible active cases in the future (expected count). Such a forecast will help the national & local authorities, administrators, and health workers to make informed decisions and timely measures to control the pandemic spread. The researchers at Somaiya Vidyavihar University are also playing an active role in this noble cause. Dr. Ninad Dileep Mehendale and his team of students from K J Somaiya College of Engineering have developed a model that could forecast the expected count with 94% accuracy.
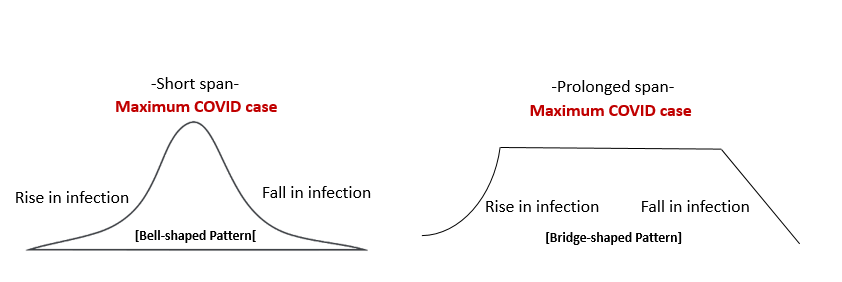
Interestingly, this current study gives a new perspective on viral infection. Until now, the simple figurative explanation for COVID infection is a bell-shaped curve. A curve that traces a slow or fast increase in the outbreak until it reaches a peak, reflecting a short period of maximum active cases and then a sudden decline in infection. Here, the team observed a bridge-like pattern, showing a fast increase in the outbreak until it reaches a peak then a flat line followed by linear decay based on the value of daily infected new cases in each country.
The researchers collated active counts of 190+ countries, updated between 31st Jan to 10th May 2020, from 'Coronavirus disease statistics' displayed on Wikipedia. Eight mathematical models were used in this study. The expected count from each model was compared with the actual counts (validated from 10th May to 25th May) to figure out the best mathematical model for prediction. Dr. Ninad lists their key findings as:
Objectives
- To ‘figure out’ the best mathematical model for predicting daily active COVID-19 count.
- Estimate the best and worst-case scenarios of COVID-19 count and the nature of the graph, followed by it
Key Findings
- Among the eight different mathematical models tested, the recursive neural network model predicted the count with the least error.
- The nature of the curve observed for COVID-19 is a 3-phase curve: an exponential rise (Phase 1), a steady phase (Phase 2), and a linear decay (Phase 3).
- The phases are divided by two points : EOP1 (marks the end of Phase 1) and EOP2 (marks the end of Phase 2).
- EOP1 indicates maximum active COVID cases, and this count remains steady in Phase 2 till EOP2, after which the number of active cases decreases.
- India has still not reached EOP1, whereas most of the countries in the world are in the transition phase from EOP1 to EOP2.
An unobstructed deep breath is what we all aim for, but technologists are making it right through deep learning. The language of math and intelligence of computers is helping humanity to figure out the best forward path to control a biological outbreak.

Ninad Dileep Mehendale
.png)

Coordinator, Research Promotion-SIRAC
Published on: 5th June 2020