Capture the heartbeat in pixels!
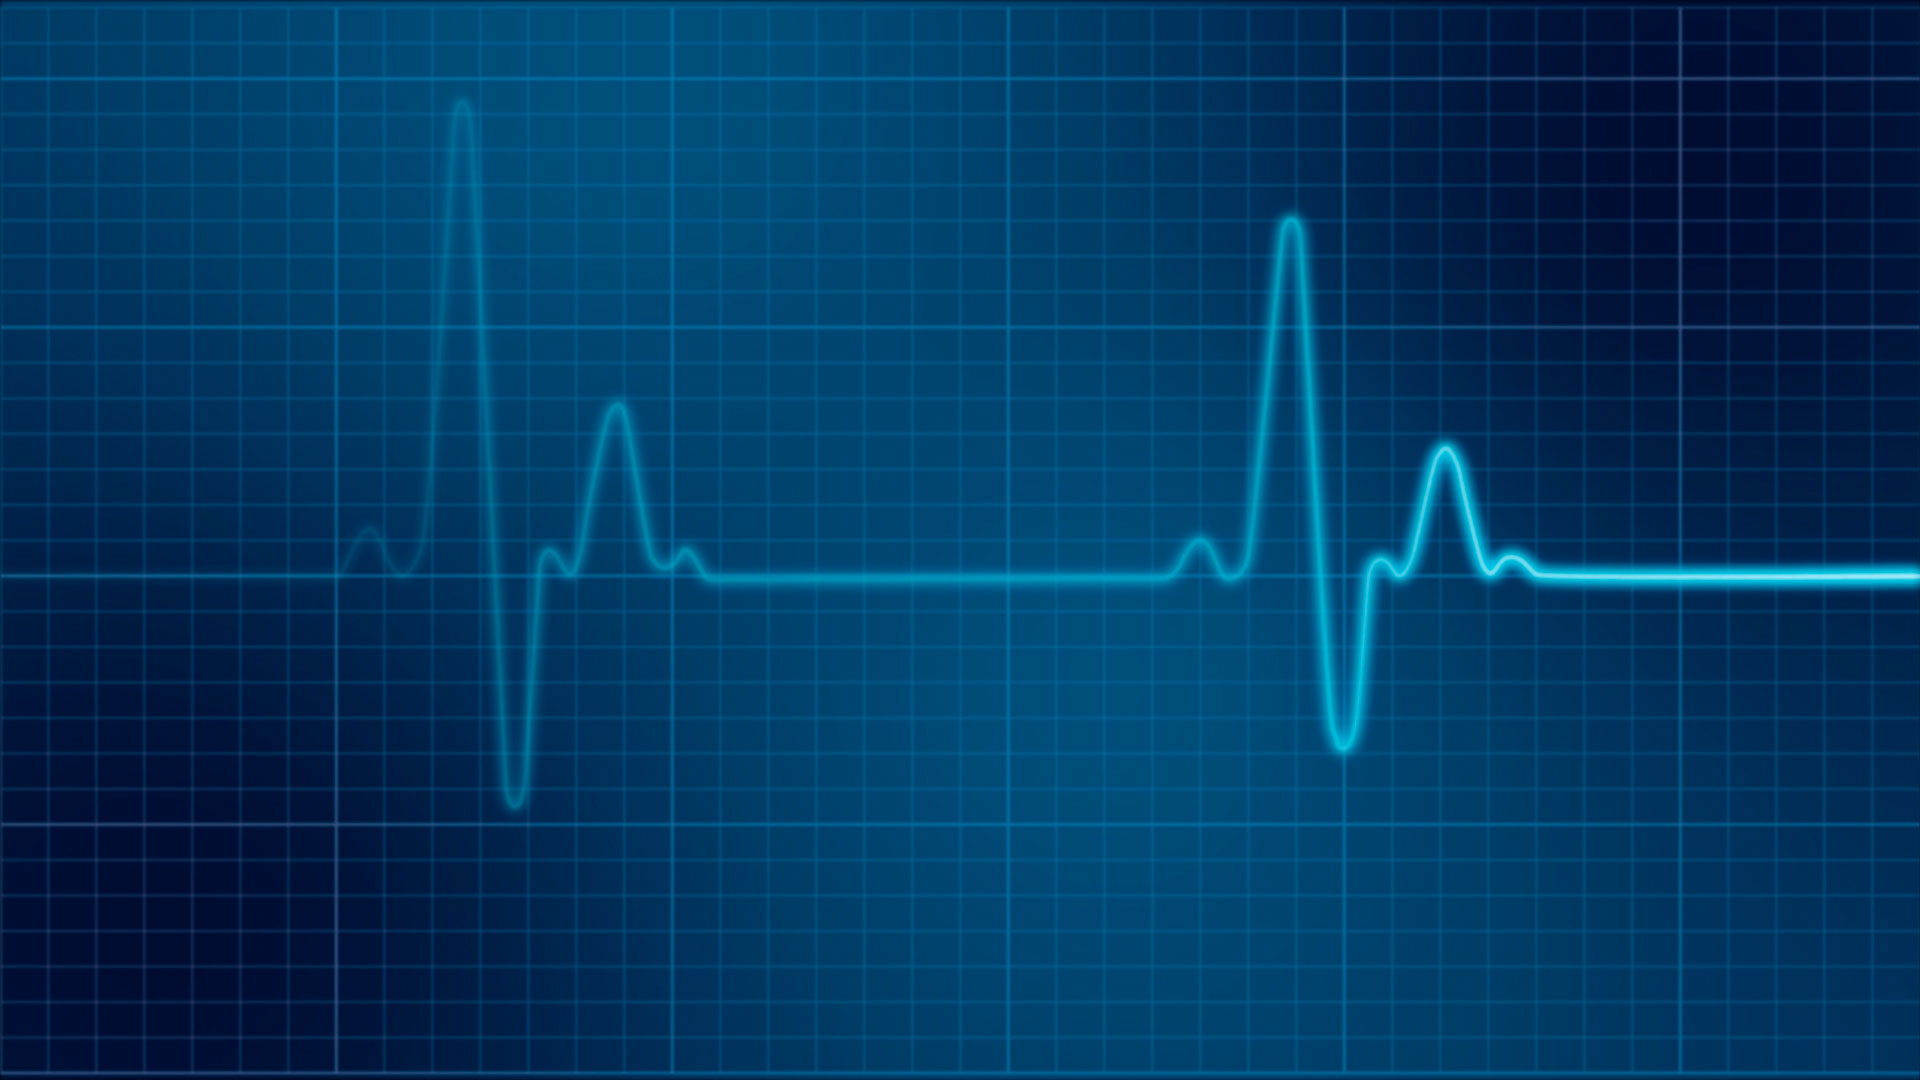
A heartbeat is an electrically conducted symphony of heart muscles to pump blood across the body. Electric conductivity induces the heart muscles to contract and expand, which is observed as a heartbeat. An electrocardiogram measures the electric conductivity of the heart and displays the heartbeat in a waveform signal. An electrocardiograph (ECG) comprises P, QRS, and T waves, spaced at different intervals. Any change in the time-intervals between two successive waves or within a single waveform indicates a heart ailment. Cardiac-related problems are reported in patients with COVID-19, the global pandemic that has sabotaged the rhythm of our lives.
The paper used for taking ECG printout are similar to graph sheets, they have grids as small and larges boxes. A single large box (5mm) or a grid comprising of 25 small boxes. The interpretation of the ECG is both subjective (shape and the time-intervals of the wave) and quantitative (300 divided by grid-boxes between consecutive R waves). Digitization of ECGs will help detect subtle changes that are directly or indirectly associated with a specific disease. “A rapid diagnostics (using machine learning) of patients is possible by converting the graphical ECG waveforms into one dimensional (1D) signal using waveform extraction,” says Dr. Ninad Mehendale, the lead investigator of the project that intends to build a digital library of ECG charts to identify signature waveforms for COVID-19.
The first stage of digitization involves pre-processing. The step encompasses alignment of the ECG image, capturing a specific area of interest, removal of the background (grids, ink marks, pen marks), sharpening the waveform (contrast) followed by binarization (color scale of black & white scale). To interpret ECG data, the team is relying on a pixel dimension of 25mm/sec for a time-voltage value of 10mm/mv. The preliminary focus of the project is to develop, compare, and identify the best MATLAB-based binarization approach.
.png)
Digitization not only allows increased opportunities to develop customized disease-specific algorithms for diagnosis but also safeguard these data for all stakeholders in cardiology research and healthcare management.

Coordinator, Research Promotion-SIRAC
Published on: 25th June 2020


